Table of Contents
Run Details
Each run is unique and has a set of run details associated with it. This includes Line, Product, Start Time, End Time, and Finished Goods.
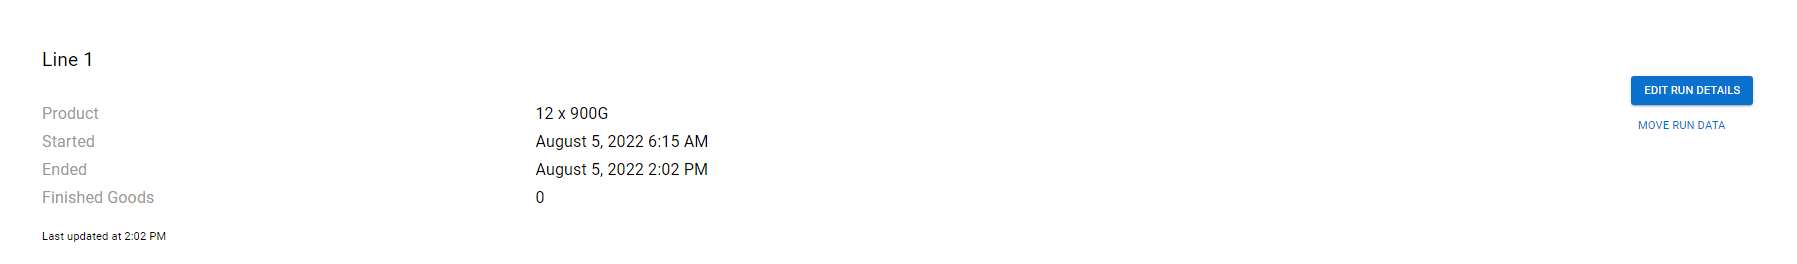
You can edit run details by clicking the blue Edit Run Details button.
Tip: These articles will help you Edit Run Details, Move Run Data, and Split Run Data.
Summary
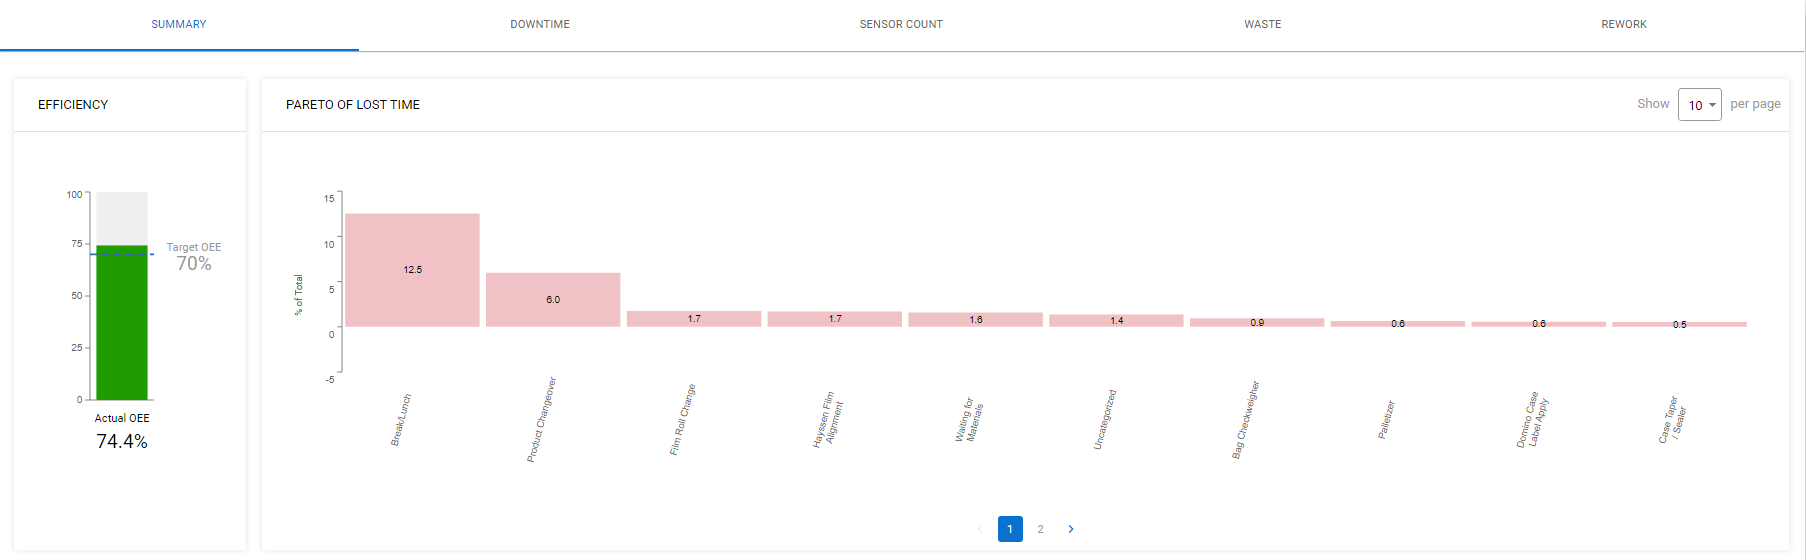
The Summary tab shows you the OEE and Pareto of Lost Time for a run.
Downtime
The Downtime tab shows you the total amount and each instance of downtime in a run. For each instance, you'll see the Reason, Start Time, End Time, Duration, and any Notes the operators have added.
To sort the downtimes, click on the column titles.
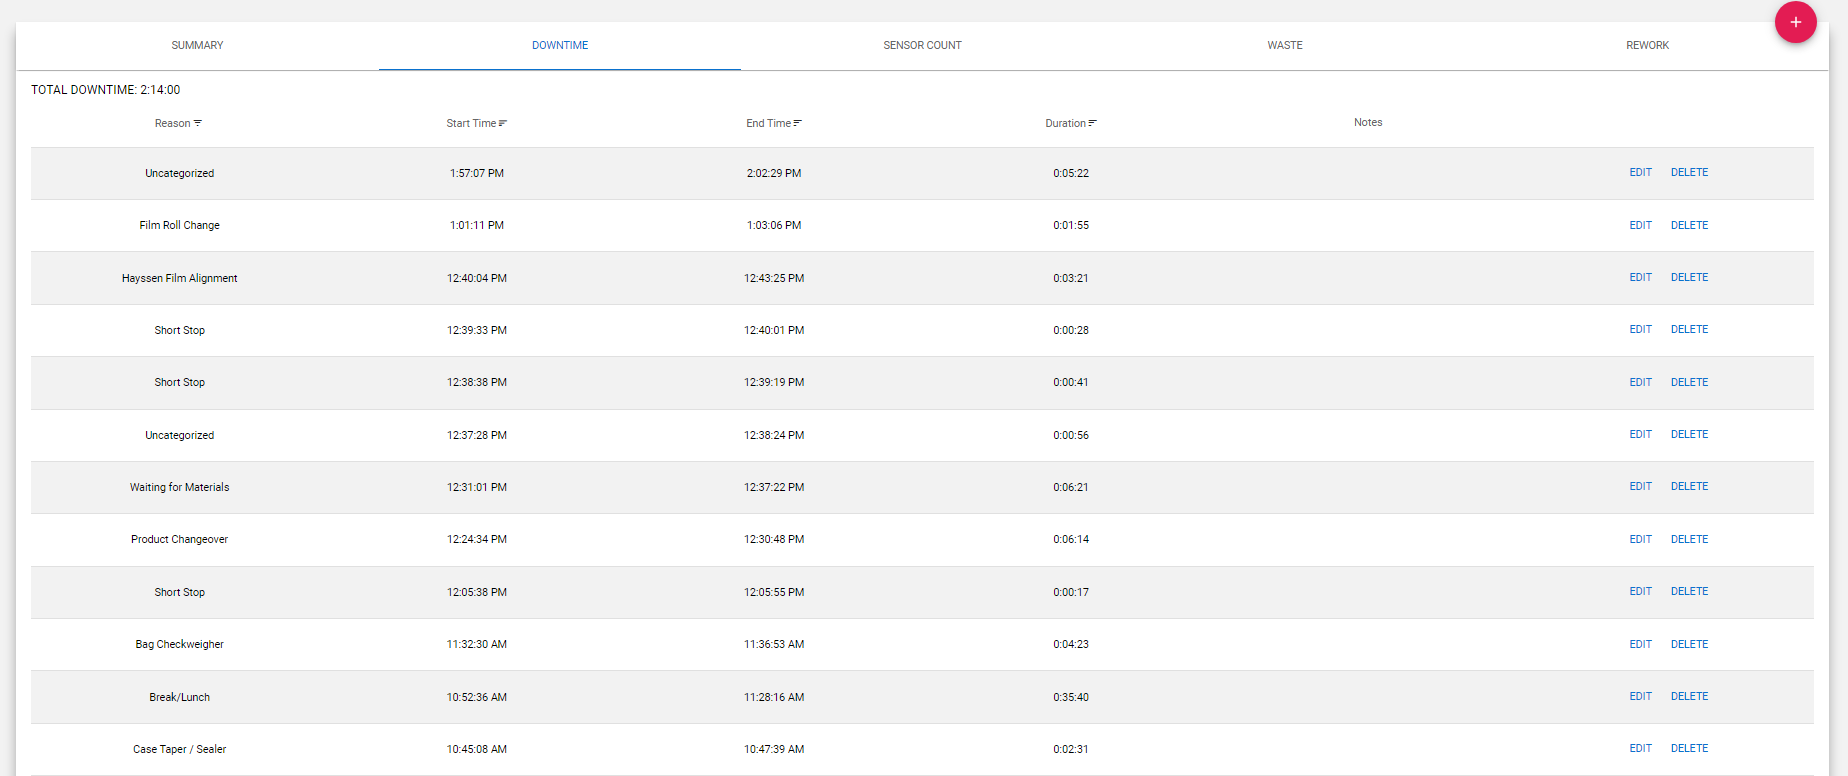
Tip: This article will help you Add, Delete, and Edit a Downtime.
Sensor Count
The Sensor Count tab displays the total and each instance of a sensor count. For each instance, you'll see the Time, Value, Unit, and Notes.
To sort the sensor counts, click on the column titles.
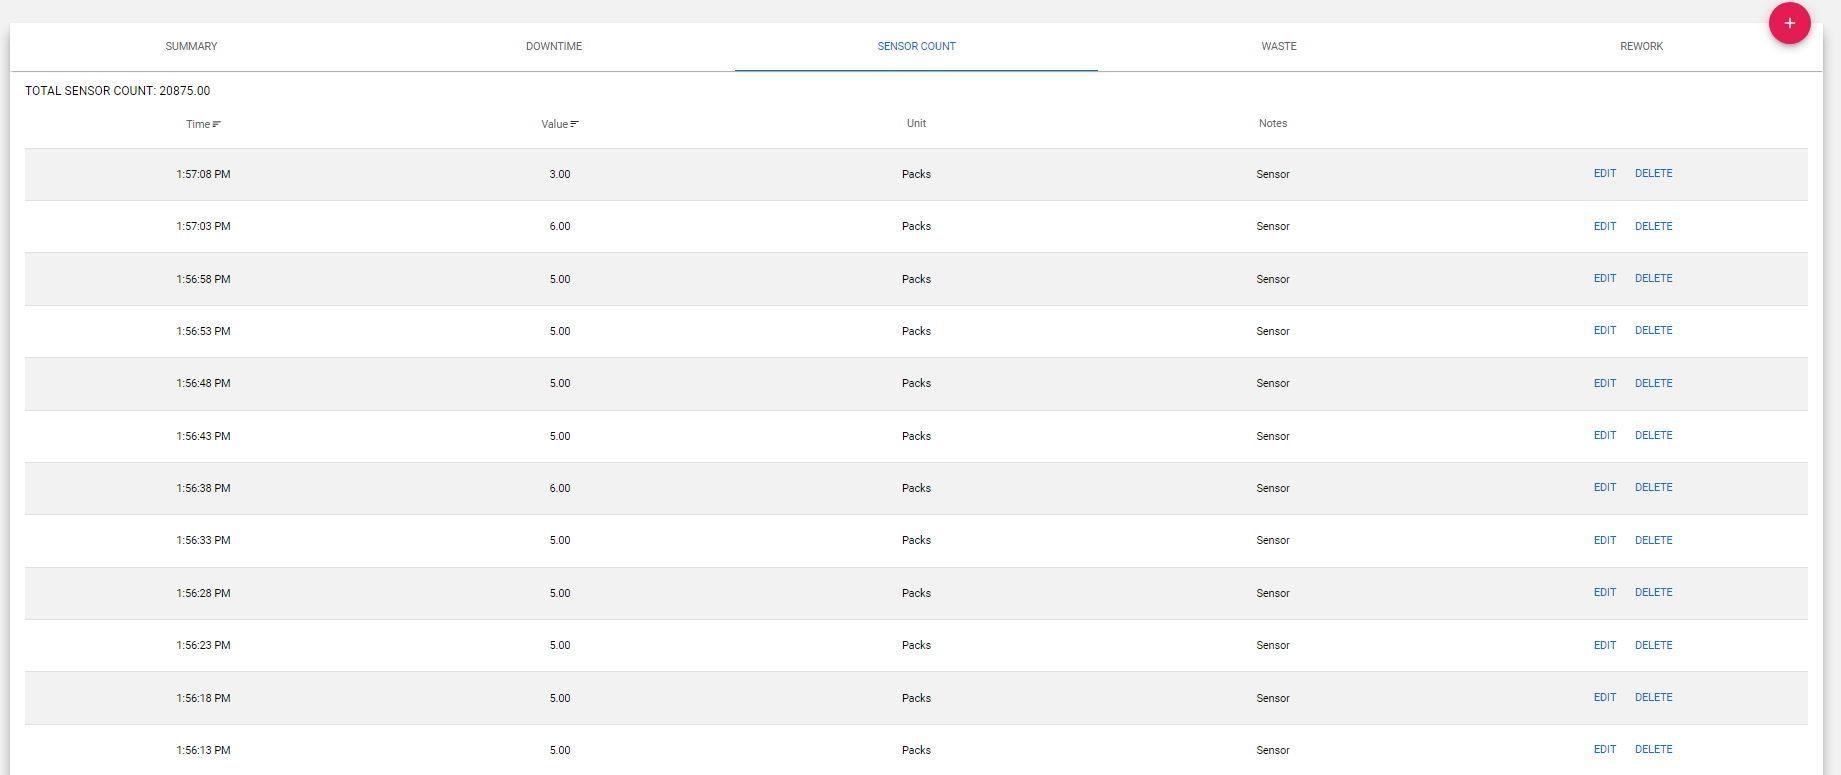
Tip: This article will help you Add, Delete, and Edit a Sensor Count.
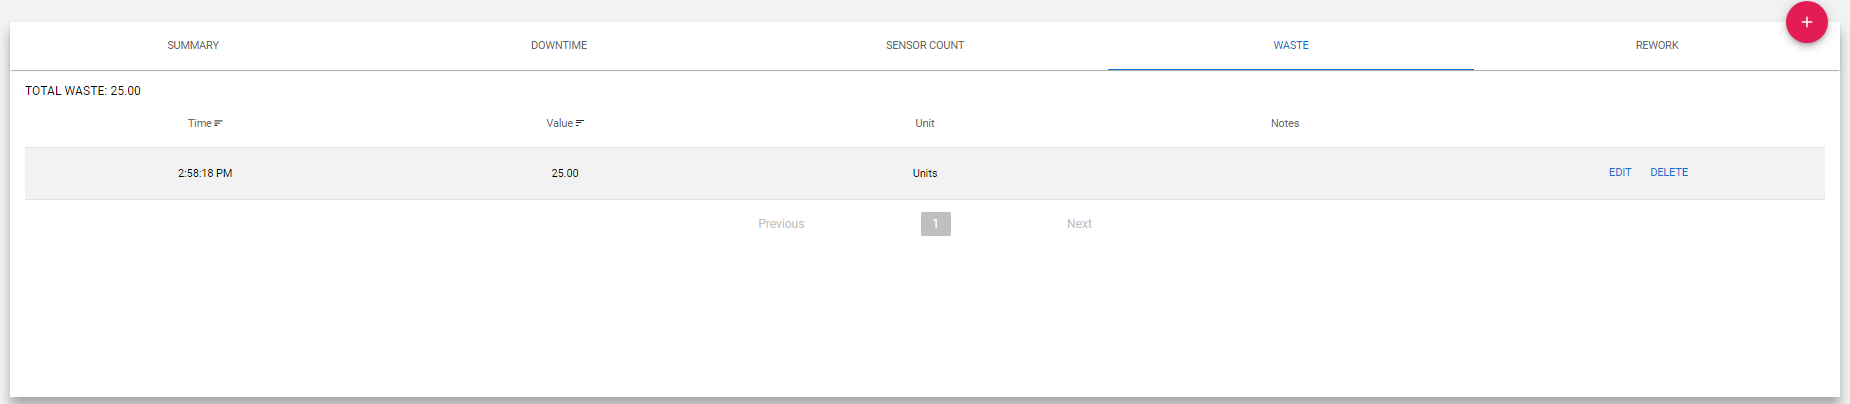
Waste
The Waste tab displays the total and each instance of waste. For each instance, you'll see the Time, Value, Unit, and Notes.
To sort the waste instances, click on the column titles.
Tip: This article will help you Add, Delete, and Edit Waste.
Rework
The Rework tab displays the total and each instance of rework. For each instance, you'll see the Time, Value, Unit, and Notes.
To sort the rework instances, click on the column titles.
Tip: This article will help you Add, Delete, and Edit Rework.
Run Timeline: Downtime
This section of the Run Report is a horizontally stacked bar graph that shows the timeline of a run, and instances of downtime.
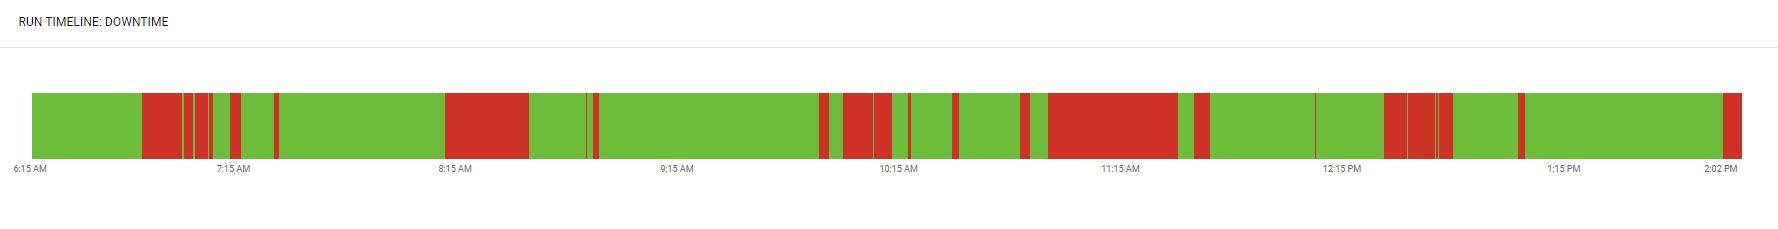
Tip: Try clicking on the Pareto in the summary tab. Each reason for lost time will highlight the corresponding issue in the Run Timeline: Downtime graph.
Run Timeline: Speed
At the bottom of the run report is the Run Timeline: Speed graph. This line graph shows a time series of line speeds over the course of a run. On it, you can see the Speed, Target Speed, and Average speed.
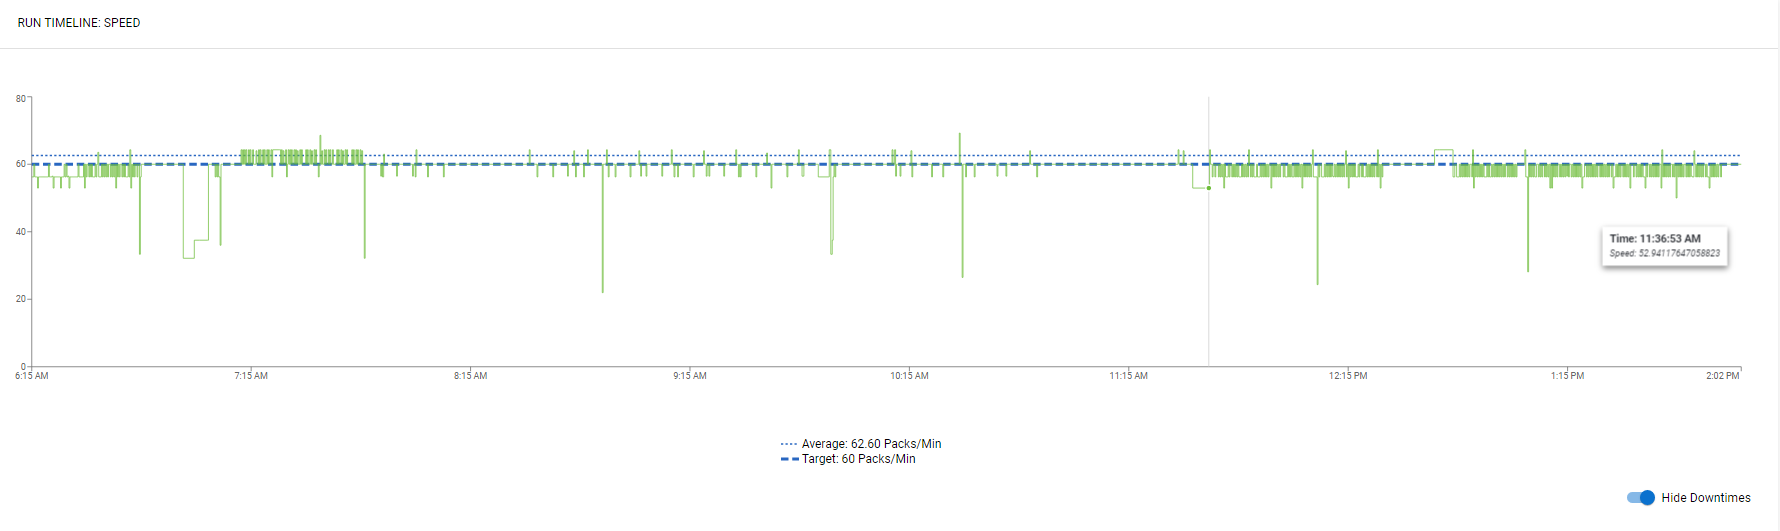
Note: You can hide or show the impact of downtimes by flicking the switch at the bottom-right corner of the graph.