Table of Contents
Overview
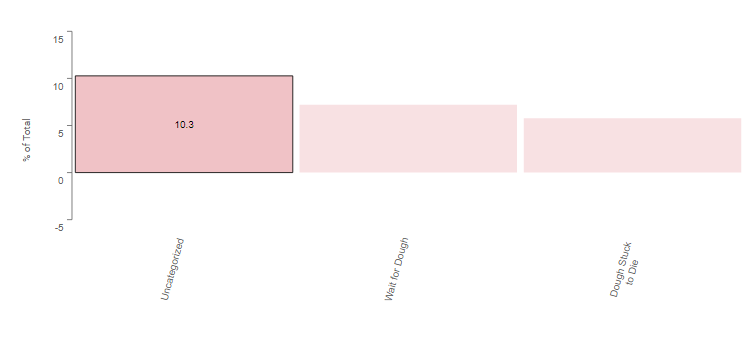
A Pareto is an ordered bar graph. The Paretos in LiveTracking show sources of Lost Time ordered from highest to lowest going from left to right.
The lost time in the Pareto is shown as a percent. To see time, hover your mouse over one of the bars. If there is a negative value, the bar will change color to green, this indicates performance that has gained time. 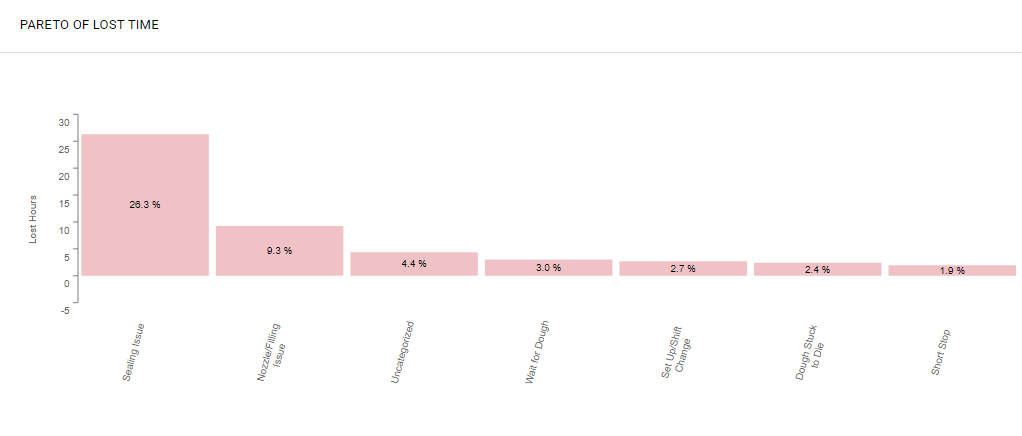
Daily Pareto
The Pareto in the Daily tab of LiveTracking allows you to drill into a downtime reason by clicking on a bar.
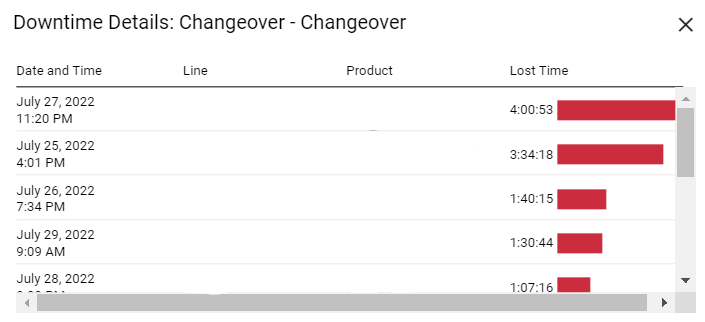
Runs in this popup are sorted from most to least downtime. From this view, you can click on any run to pull up the corresponding Run report.
Run Report Pareto
A central part of the Run report is the Pareto of Lost Time. Clicking on the bars on the Pareto will highlight the matching downtime in the Run Timeline graph below.