Table of Contents
Overview
Trend Reports allow you to see the change in line performance over time. Analyzing these changes allows you to pinpoint improvements and regressions in performance. To navigate to Trend Report, click on the line graph icon from the menu.
Graphs
The Trend Report shows you 6 graphs. OEE by week, Lost Time (4 Week Average), and the 4 Top Trending Issues.
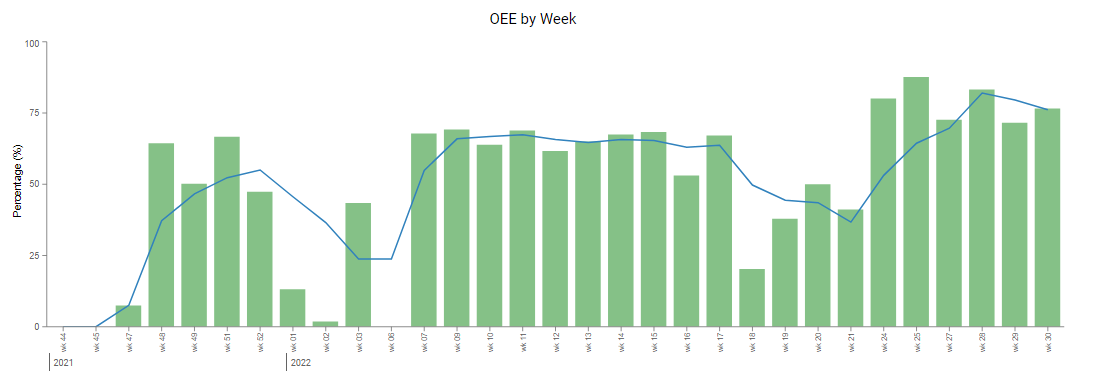
OEE by Week
This graph shows your historical OEE per week, with a 4-week moving average overlayed on top. By hovering over a data point, you can see the date, OEE, and moving average values.
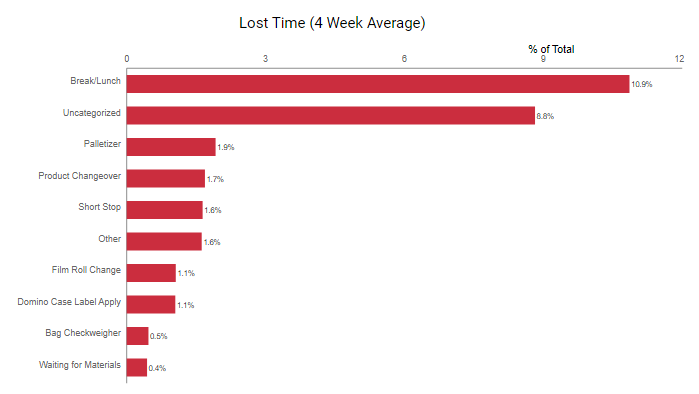
Lost Time (4 Week Average)
The Lost Time graph is a Pareto showing the largest sources of Lost Time. Hovering over the bars will show you the time value of the bar.
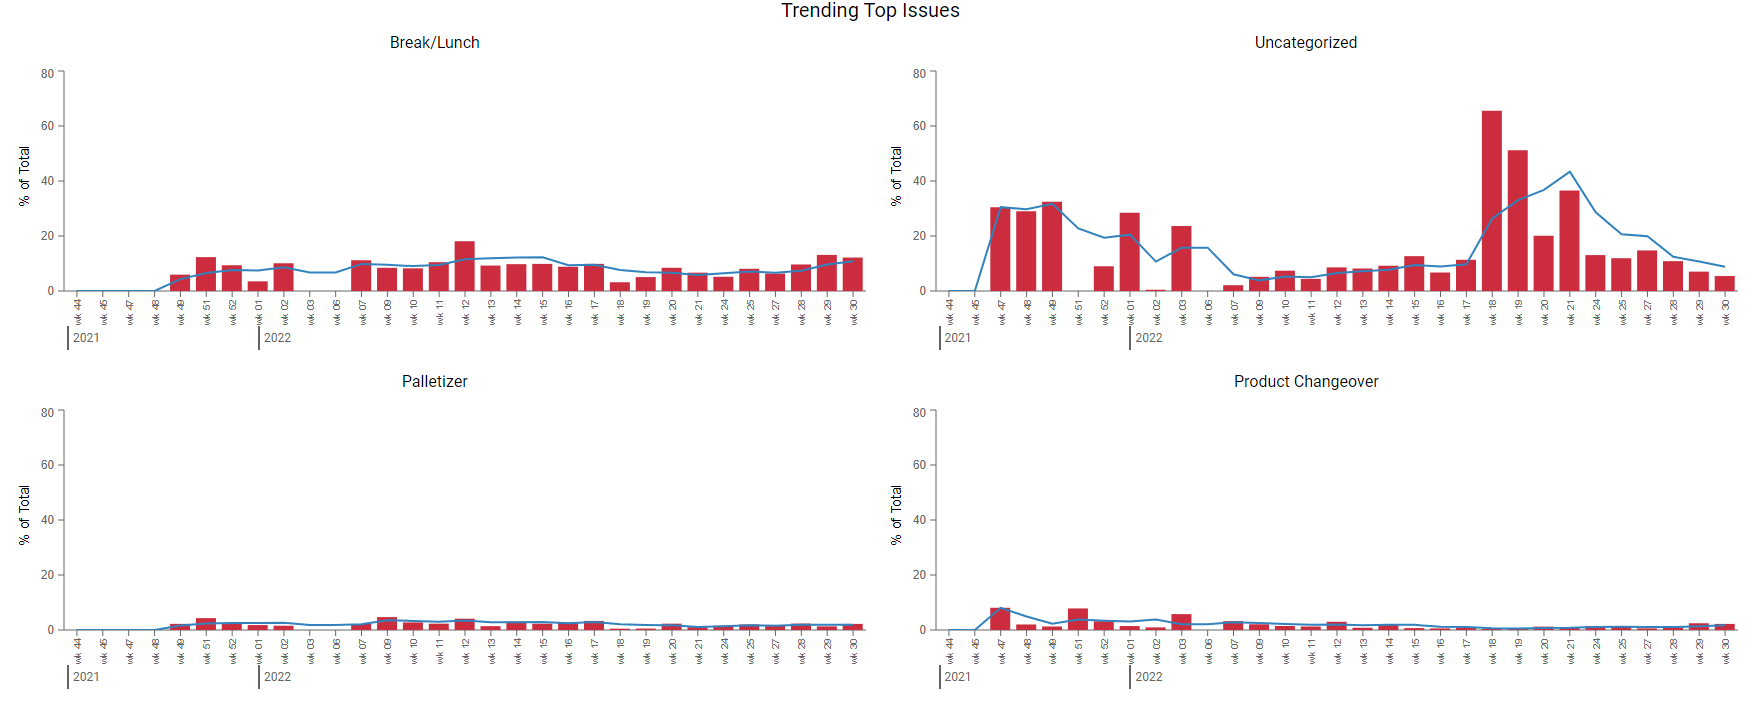
Trending Top Issues
The top 4 issues that appear in the Lost Time (4 Week Average) graph will show as your Trending Top Issues. Each issue is displayed as a time series showing the percent of total lost time that issue was responsible for, along with a 4-week average trendline.
Filters
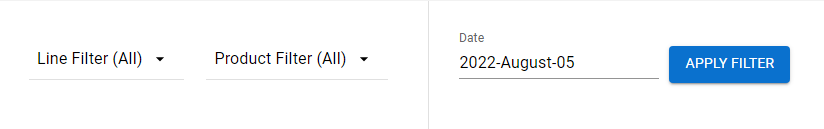
The Trend Report can be filtered by Line, Product, and Date. Filters are located at the top left of the screen. You can mix and match any number of lines or products when filtering. The date filter is a single date that represents when the report ends. For example, selecting August 1st would show weekly results up to the week preceding August 1st.
Download PDF
You can download the Trend Report by selecting Download PDF on the top right of the report screen.