Table of Contents
Overview
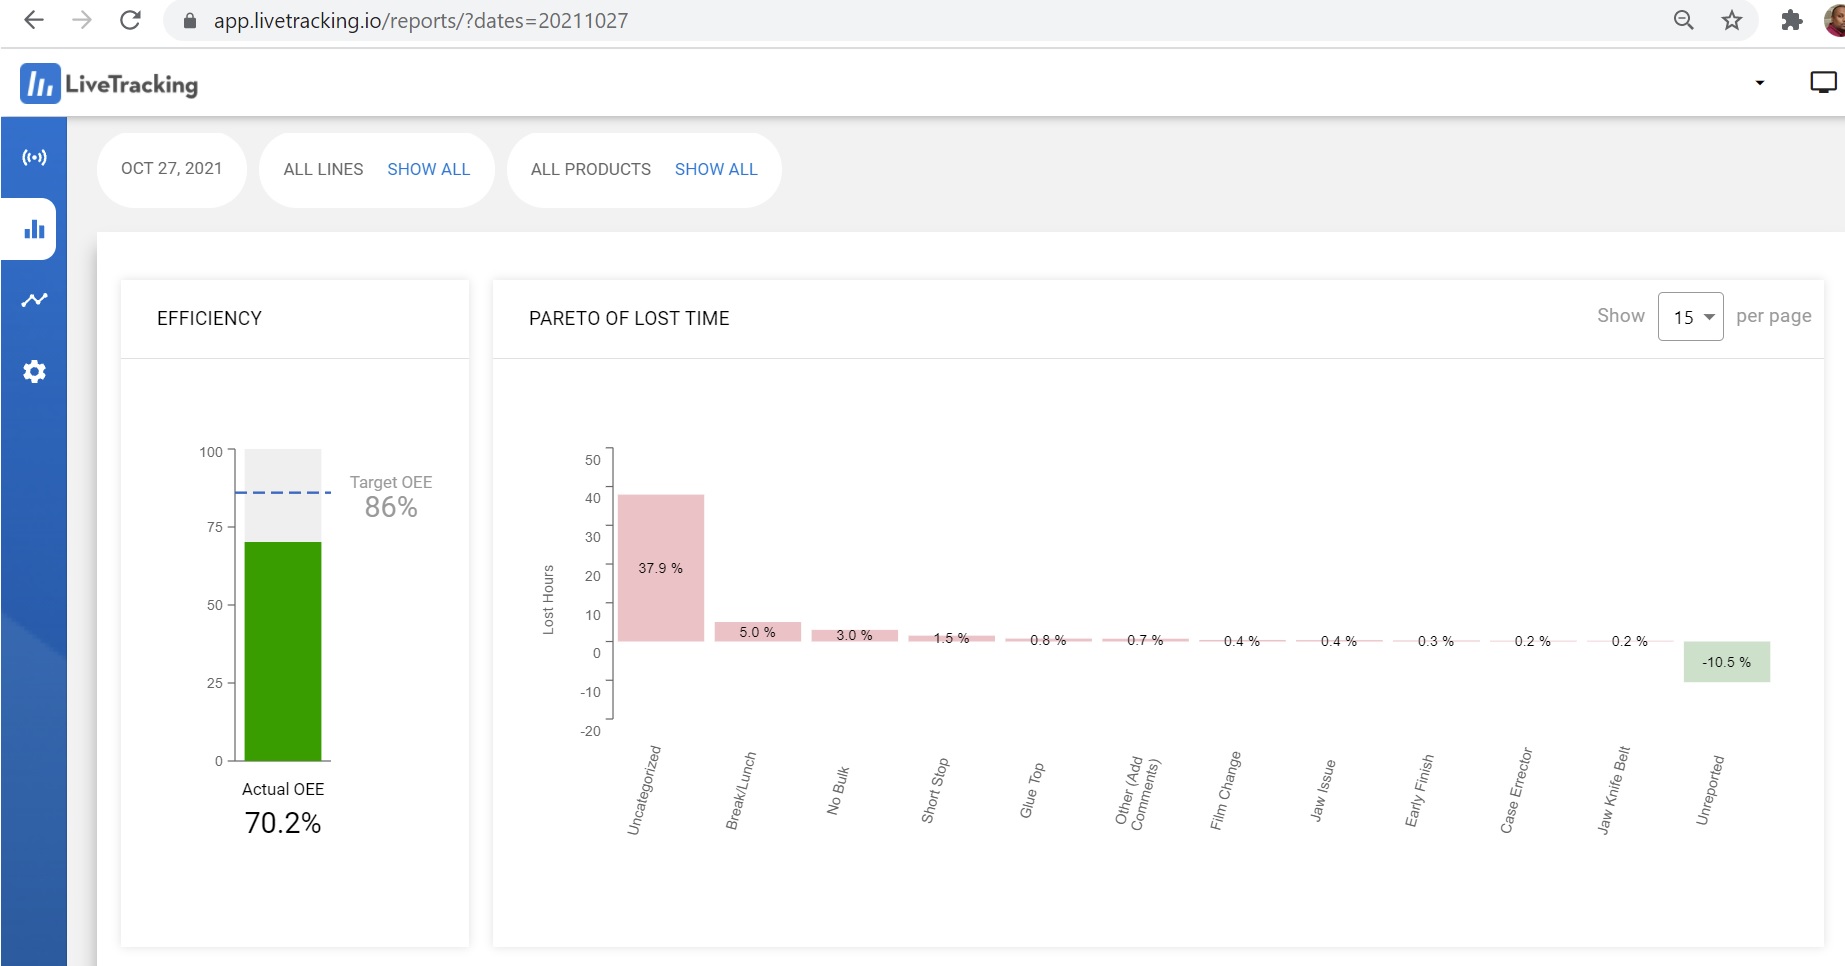
The Daily tab breaks down into two main pieces, Efficiency & Pareto of Lost Time and the Run log. The daily tab will automatically display data from the current date. Using the filters at the top, you can view specific dates, lines, and products.
Efficiency & Pareto of Lost Time
The Efficiency graph on the left shows you the OEE for all the runs currently filtered. The Pareto of Lost Time is an ordered bar graph showcasing all the lost time from the runs currently filtered for.
Note: For more information on Pareto's in LiveTracking, click here.
Run Log
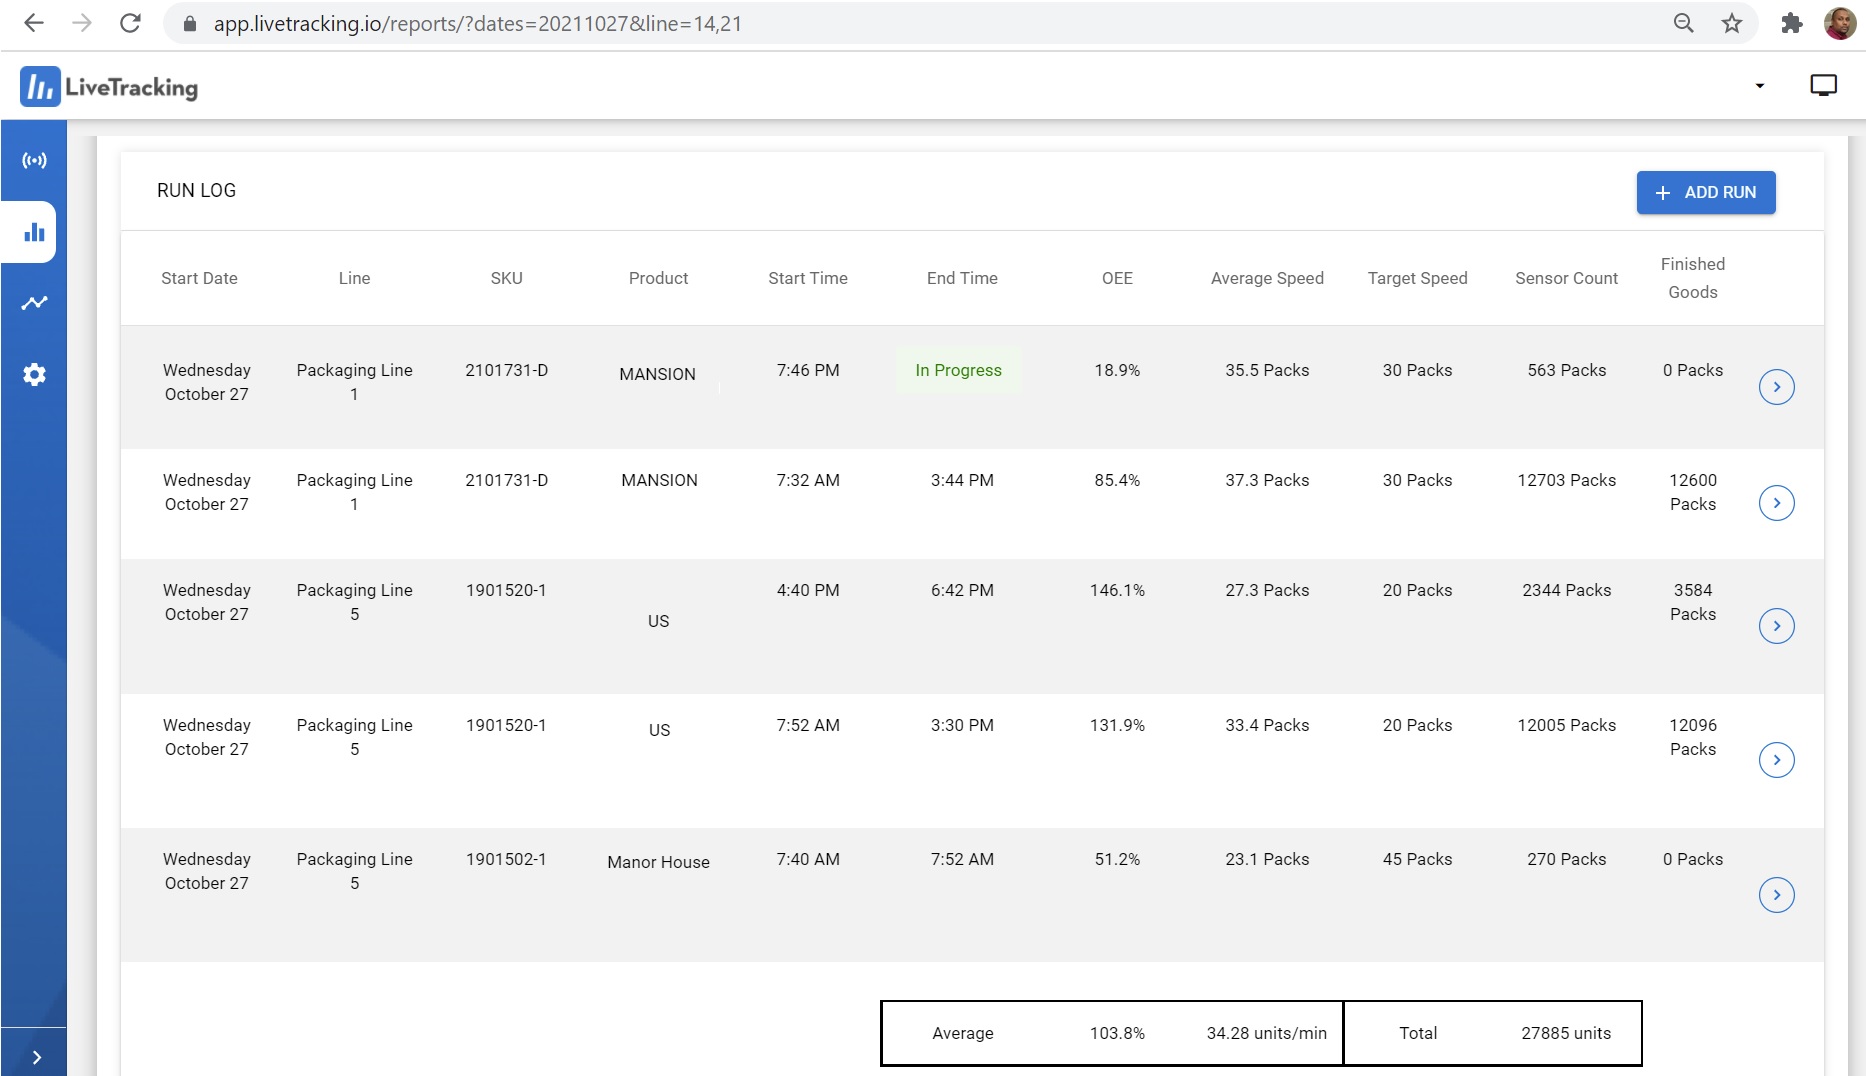
The Run Log at the bottom of the Daily tab shows information from individual runs. By clicking on a run, you can open that run's specific Run report.
Filter
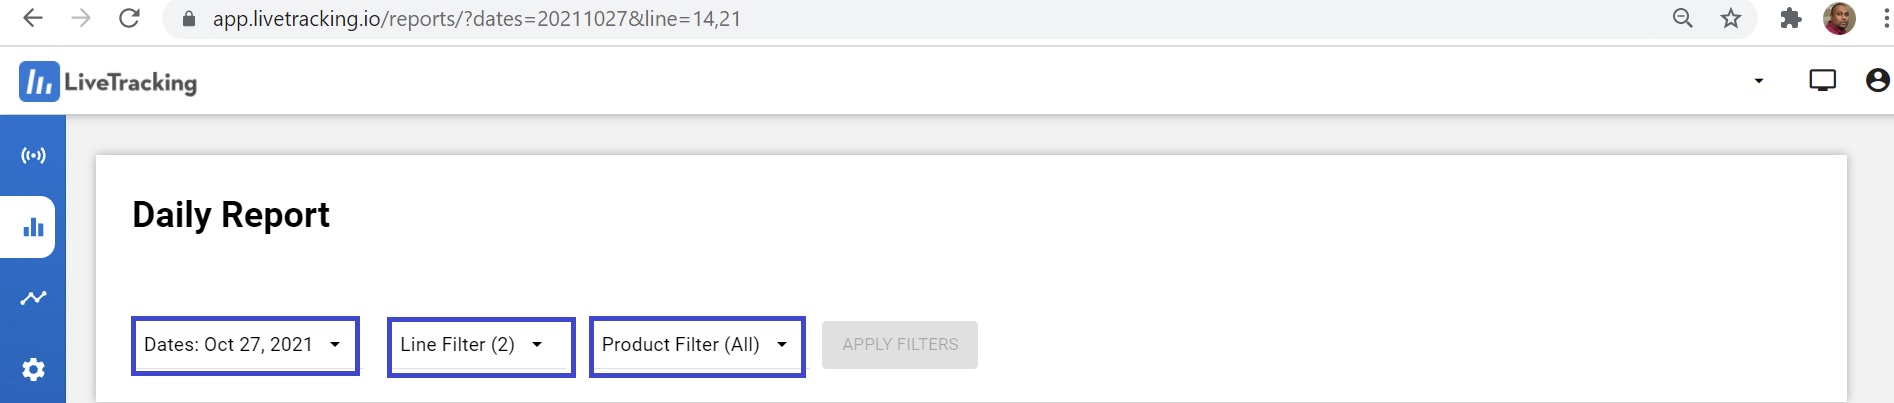
At the top of the page, there are three filters: Date, Line, and Product. Using these fields, you can filter for runs that meet specific criteria.
Tip: The Date filter can handle selected dates or a date range. (Ex. Jan 1, Jan 5, Jan 7)